Host runtime
Docker Desktop 29.2.0 on macOS, aarch64, 10 CPUs, 7.65 GiB assigned
 WAFWikiIndependent WAF intelligence
Original WAFWiki lab
Local Docker response-time baseline with 40 sequential requests per path for a direct upstream, ModSecurity NGINX, and Coraza Caddy, plus memory snapshots and limits.
Evidence policy
WAFWiki separates verified smoke-test results from architecture diagrams and methodology notes. A smoke test proves one narrow local path; it does not claim full production readiness.
Environment
Docker Desktop 29.2.0 on macOS, aarch64, 10 CPUs, 7.65 GiB assigned
40 sequential curl requests per path, 120 response-time samples total
go-httpbin 2.21.0 on 127.0.0.1:18180
ModSecurity 3.0.16 + NGINX + OWASP CRS 4.25.0 on 127.0.0.1:18181
Coraza 3.7.0 + Caddy 2.11.2 + OWASP CRS 4.25.0 on 127.0.0.1:18182
curl time_total, Docker stats --no-stream after request samples
Commands
scripts/run-waf-evidence-lab.shThe JSON summary contains 40 samples each for upstream, ModSecurity, and Coraza.
node --input-type=module -e 'const j=await import("./docs/lab-evidence/waf-engine-comparison-2026-07-26.json", { with: { type: "json" } }); console.log(j.default.benchmarks, j.default.resources)'The command prints median, p95, sample counts, and WAF container resource snapshots.
Observed result
Direct upstream
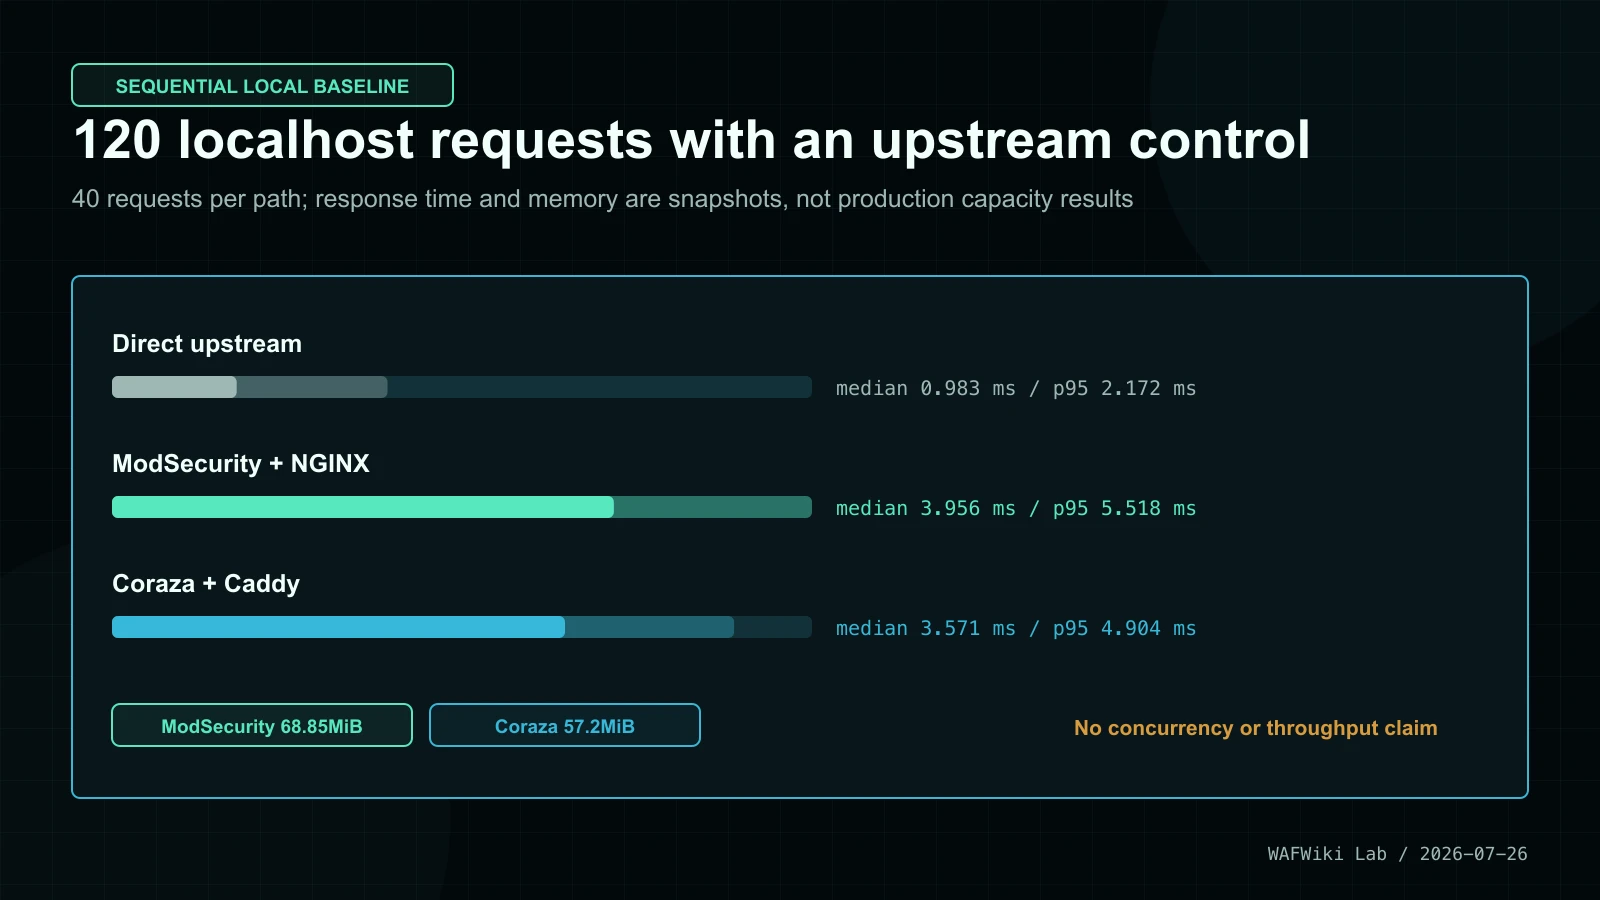
The unprotected go-httpbin control recorded a 2.172 ms p95 in the final sequential run.
ModSecurity path
The ModSecurity and NGINX path recorded a 5.518 ms p95 across 40 requests.
Coraza path
The Coraza and Caddy path recorded a 4.904 ms p95 across 40 requests.
Memory snapshot
Docker reported 68.85 MiB for ModSecurity and 57.2 MiB for Coraza after the samples; no sizing conclusion is claimed.
Performance winner
One sequential localhost run without concurrency, repetitions, isolation controls, or production traffic cannot rank capacity.
direct upstream: median=0.983ms p95=2.172ms n=40
ModSecurity + NGINX: median=3.956ms p95=5.518ms n=40
Coraza + Caddy: median=3.571ms p95=4.904ms n=40
ModSecurity memory snapshot: 68.85MiB
Coraza memory snapshot: 57.2MiB
measurement mode: sequential localhost curl time_total
Evidence context
Adding the direct route makes the measurements easier to interpret, but the run still cannot isolate every proxy, engine, container, scheduler, logging, and warm-up effect.

Open evidence
The files expose the status matrix and versioned summary without publishing raw container logs or unrelated local data.
Twenty request outcomes with engine, case, method, path, expected status, observed status, and curl time.
Pinned image IDs, component versions, host details, request results, latency samples, resource snapshots, and limitations.
Limitations
Related research